Finance & Invoicing
Finance is the complete back-office of your workspace: revenue and profit, what you're owed and what you owe, the full set of financial documents, Greek e-invoicing, warehouse and dispatch, planning and reporting — all in one place. This page is your orientation: it teaches you how to read the Dashboard at a glance, then points you to the focused sub-pages for everything deeper.
How to open it: top navigation → Finance. The Dashboard tab opens first; use the tab bar across the top for everything else.
What it is
Finance is the accounting and billing centre of your workspace. It's where invoices are created and transmitted to the Greek tax authority, where you track every euro coming in and going out, where the warehouse/dispatch side runs, and where you plan ahead and report. The Dashboard tab is the front door — a single screen that tells you the financial health of the business — and the rest of the tabs handle the day-to-day work behind those numbers.
Why it matters
Most of your business decisions come down to two questions: how much money is the business actually making, and is cash coming in fast enough to cover what's going out. The Dashboard answers both without you opening a spreadsheet. Once you can read it, you'll spot an overdue customer, a thin-margin month, or a slow-collection problem the moment you log in — instead of finding out at the end of the quarter.
How to read the Dashboard
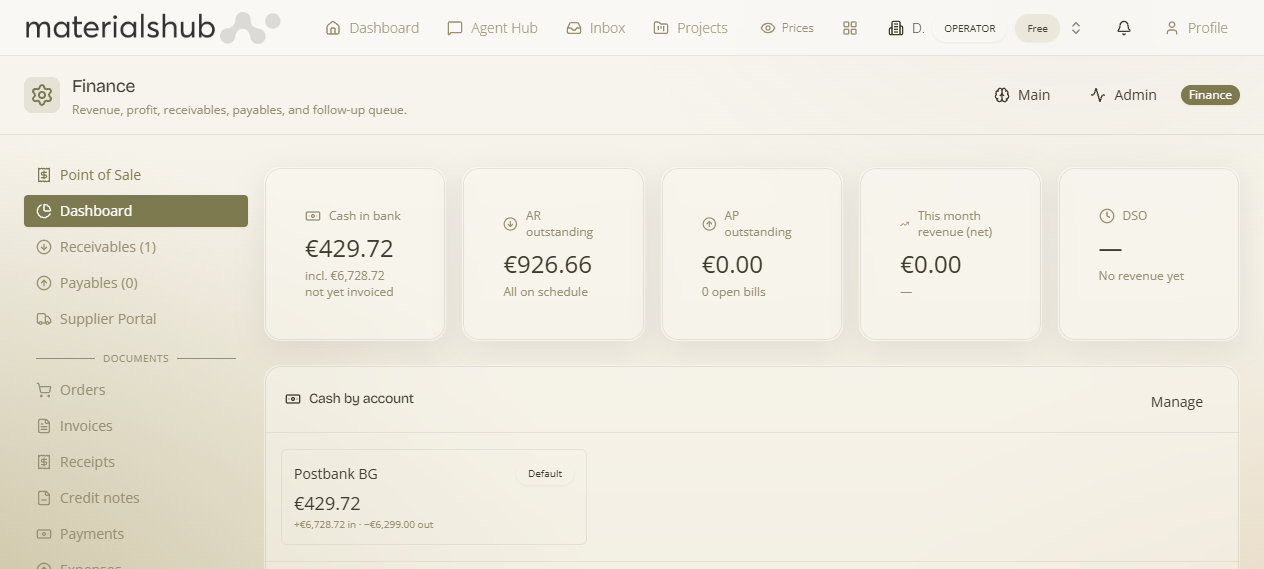
The Dashboard summarises four things up front: revenue & profit for the period, receivables (money customers owe you), payables (money you owe suppliers), and a follow-up queue of items that need action, such as overdue documents. Two layers do the work: the KPI cards at the top, and the cash-flow table below them.
The KPI cards
Across the top of the Dashboard, a row of cards gives you the headline numbers. Read them left to right as a quick health check — owed to you, owed by you, this month's earnings, how fast you collect, and the cash you actually hold:
- AR outstanding — the total amount (€) customers currently owe you, with a status indicator (e.g. "All on schedule") summarising whether receivables are on track. A rising number with a worsening status is your cue to chase payment.
- AP outstanding — the total amount (€) you currently owe suppliers, alongside a count of open bills. This is your near-term cash obligation.
- This month revenue (net) — net revenue recognised for the current month, so you can compare your earning pace against previous months.
- DSO (rough) — a rough Days Sales Outstanding figure in days: how long, on average, it takes to collect what you're owed. Lower is better. It also shows a count of quotes needing follow-up. A climbing DSO means money is sitting in receivables longer than it should.
- Cash in bank — your actual cash position: all payments in minus all payments out. Where AR/AP show what's promised, this shows what you have right now. Its subtext flags any cash “not yet invoiced” — see deposits below.
“Received, not yet invoiced” — deposits / on-account
When you take money before raising a document — a deposit or an on-account payment — that cash is in your bank but isn't revenue yet (it's not in your P&L or receivables). The Dashboard surfaces it in a dedicated “Received, not yet invoiced — deposits / on-account” card (shown only when there's a balance), and the Cash in bank KPI notes how much of your cash this is. Each row can be reconciled: turn the order the deposit was taken on into a receipt/invoice draft (review it, then issue & transmit to myDATA), at which point the money becomes proper revenue. This keeps held cash visible instead of silently inflating your earnings.
The monthly cash-flow table
Below the cards, a month-by-month table breaks down money movement and profitability side by side. The left columns (In / Out / Net) are pure cash flow — what actually moved through the bank. The right columns (Revenue / COGS / Margin / %) are profitability — what you earned versus what it cost. Reading both together tells you whether a profitable month was also a cash-positive one:
| Column | What it shows | How to read it |
|---|---|---|
| Month | The calendar month for the row. | One row per month — scan down for trends. |
| In | Money received during the month. | Actual cash collected, regardless of when it was invoiced. |
| Out | Money paid out during the month. | Actual cash spent. |
| Net | In minus Out — the net cash movement. | Positive = cash grew that month; negative = it shrank. |
| Revenue | Revenue recognised in the month. | What you earned, which can differ from cash In. |
| COGS | Cost of goods sold for the month. | The direct cost of what you sold. |
| Margin | Revenue minus COGS. | Your gross profit for the month. |
| % | Margin as a percentage of revenue. | Your profitability rate — watch for it slipping over time. |
A month can show strong Margin but a negative Net — that's a profitable month where the cash hasn't landed yet (it's sitting in receivables). That's exactly the gap the DSO card and the Receivables tab are there to close.
Acting from the Dashboard
The Dashboard isn't read-only — two buttons let you act on what you see without leaving the screen:
- New — create a financial document directly from the Dashboard.
- View all — jump to the full listing for the figure you're looking at.
Where to go next — the sub-pages
Finance is deep, so the detail lives on focused sub-pages. Use these cards (or the sidebar) to dive into each area:
Receivables & Payables
What you're owed and what you owe, follow-ups, payments and cheques.
Documents
Invoices, receipts, credit notes, expenses, delivery notes and categories.
Greek e-invoicing
myDATA / ΑΑΔΕ transmission and VAT validation.
Operations & Reports
Dispatch, warehouse, planning, time & billing, reports, settings.
Settings — 12 sections
Business Identity, Documents/series, e-Invoicing, Pricing, Categories, Services, Team, Online Store, Statement PDF, Finance Digest, Payments, General.
Point of Sale
Issue receipts and invoices at the counter.
The full tab map
Behind the Dashboard, Finance is organised into a wide set of tabs grouped by purpose. This map shows you everything available so you know where each job lives:
| Group | Tabs |
|---|---|
| Overview | Dashboard · Receivables · Payables · Follow-ups |
| Documents | Invoices · Receipts · Credit notes · Payments · Expenses · Delivery notes · Cheques |
| Operations | Dispatch board · Warehouse · Customers & Suppliers |
| Planning | Planning · Time & billing · Reports |
| Other | Marketplace · Settings |
Access & what it affects
Finance is gated by the finance.manage capability and module entitlement, so only authorised members reach it. Note that /settings redirects here — workspace settings live under Finance, not separately. An Admin sub-view is available to operators for configuration.
Everything you do across the sub-pages feeds back into this Dashboard: an issued invoice raises Revenue and AR, a recorded payment moves cash to In, an expense increases AP. The Dashboard is the live mirror of all the work happening in the tabs below it.